Iron Studies Explained: Serum Iron, TIBC, Transferrin and Saturation
Iron studies go beyond ferritin — they reveal the difference between iron deficiency, anaemia of inflammation and iron overload. Learn the pattern each condition produces.
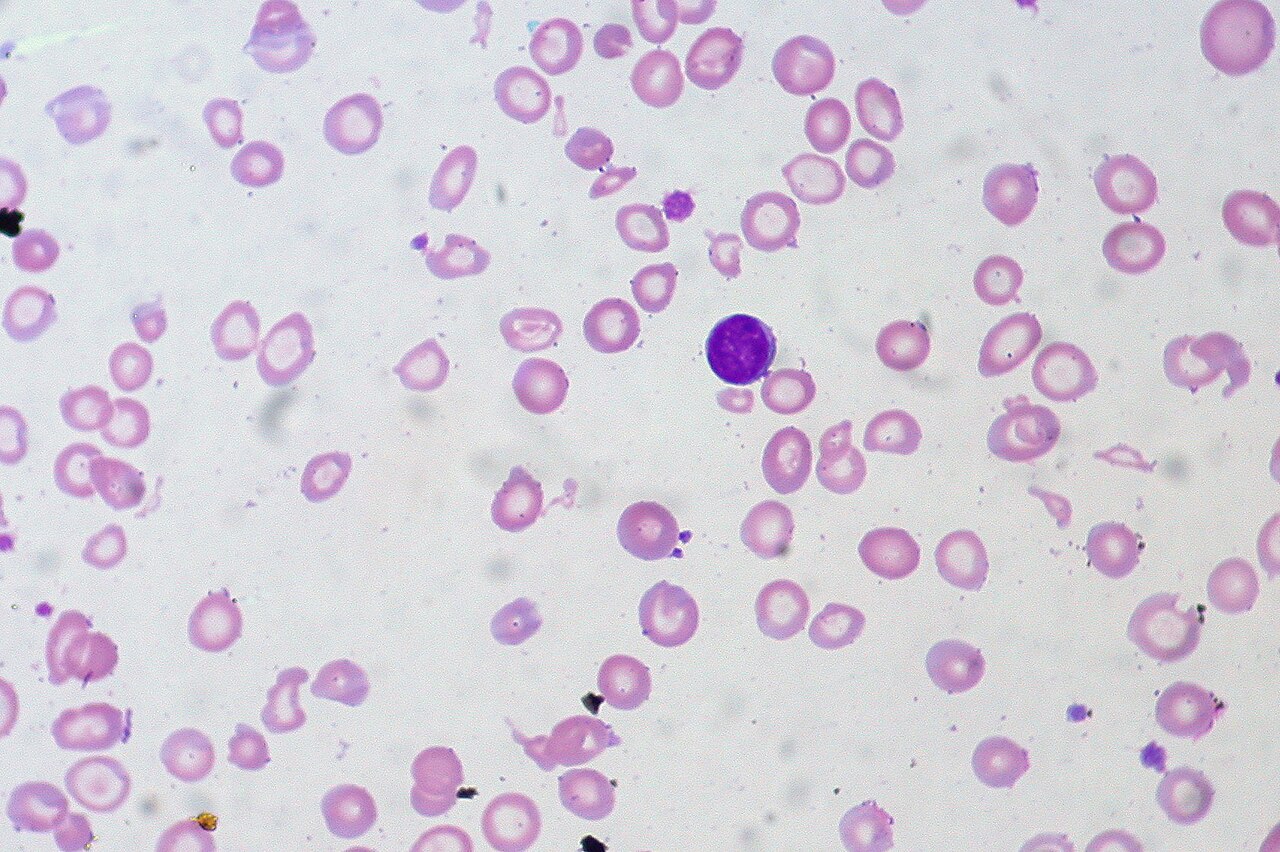
A full iron panel measures serum iron (60–170 µg/dL), total iron binding capacity or TIBC (240–450 µg/dL) and calculates transferrin saturation (20–50%). In iron deficiency: iron LOW, TIBC HIGH, saturation < 15%. In anaemia of chronic disease: iron LOW, TIBC LOW, saturation normal or low. In haemochromatosis: iron HIGH, TIBC LOW, saturation > 45%.
Iron studies interpret three interdependent measurements. Serum iron is the amount currently in transit on transferrin; it varies diurnally by 20–30% (peak in morning). TIBC reflects the amount of transferrin available for iron transport — it rises in iron deficiency (the body upregulates transferrin) and falls in inflammation or malnutrition. Transferrin saturation = (iron ÷ TIBC) × 100; it is the most useful single derived value. Saturation < 15% strongly suggests iron deficiency; > 45% suggests iron overload. Always interpret iron studies with ferritin — the pattern quartet clinches the diagnosis.
- Serum iron
- 60–170 µg/dL (11–30 µmol/L)
- TIBC
- 240–450 µg/dL
- Transferrin saturation
- 20–50%
- Iron deficiency saturation
- < 15%
- Haemochromatosis saturation
- > 45%
What each measurement means
Serum iron: the concentration of iron circulating on transferrin at the moment of the draw. It varies diurnally (highest early morning) and after meals — draw fasting in the morning for consistency.
TIBC: total iron binding capacity — a measure of the transferrin protein's carrying capacity. Iron deficiency triggers the liver to make more transferrin (higher TIBC); inflammation or malnutrition drops production (lower TIBC).
Transferrin saturation: the percentage of transferrin sites currently occupied by iron. This is the most physiologically meaningful number because it combines supply (iron) with capacity (TIBC).
Iron panel patterns
| Condition | Iron | TIBC | Saturation | Ferritin |
|---|---|---|---|---|
| Iron deficiency | Low | High | < 15% | Low |
| Anaemia of chronic disease | Low | Low | Normal or low | Normal or high |
| Iron overload / haemochromatosis | High | Low | > 45% | High |
| Sideroblastic anaemia | High | Normal | High | High |
| Recent iron supplementation | High (transient) | Normal | High | Normal or high |
When to order iron studies vs ferritin alone
Ferritin alone is enough for most iron deficiency screening. Order the full iron panel when: (1) inflammation is present and ferritin is unreliable; (2) diagnosing haemochromatosis (saturation is the key first-line marker); (3) atypical anaemia patterns where the pattern quartet clarifies which mechanism is dominant.
What causes each pattern
Iron deficiency: menstrual loss, GI bleeding, dietary shortfall, malabsorption (coeliac, IBD, gastric bypass), pregnancy demands.
Anaemia of chronic disease: rheumatoid arthritis, chronic infections, malignancy, CKD, chronic liver disease. Hepcidin is elevated, trapping iron in macrophages — supply low, capacity low.
Iron overload: hereditary haemochromatosis (HFE C282Y homozygous most common), transfusion-dependent anaemia, chronic liver disease.
- Transferrin saturation > 45% with elevated ferritin — screen for haemochromatosis.
- Iron studies suggest deficiency in a man or postmenopausal woman — always assess GI bleeding.
- Bronze skin, joint pain, new diabetes with elevated iron studies — iron overload workup.
- Iron deficiency plus GI symptoms (weight loss, altered bowel habit) — urgent GI referral.
Iron panel interpretation walk-through
- 1Iron low, TIBC high, saturation < 15%?Iron deficiency. Investigate cause (menstrual, GI, dietary). Replace iron.
- 2Iron low, TIBC low, saturation normal?Anaemia of chronic disease. Investigate underlying inflammatory or renal disease. Iron replacement is usually ineffective without treating the underlying cause.
- 3Iron high, TIBC low, saturation > 45%?Iron overload workup. HFE gene testing, hepatology referral. Consider phlebotomy.
- 4Mixed picture with inflammation?Iron deficiency can be masked. Check soluble transferrin receptor or trial iron supplementation with follow-up.
Related questions people ask
- What does high ferritin low iron mean?
- Is transferrin saturation more accurate than ferritin?
- What is haemochromatosis?
- Why is TIBC high in iron deficiency?
- How do I read a CBC after iron studies?
- When is IV iron indicated?
- How does inflammation affect iron studies?
Frequently asked questions
- Pattern reading (iron + TIBC + saturation + ferritin) beats any single value.
- Iron deficiency: iron low, TIBC high, saturation < 15%, ferritin low.
- Anaemia of chronic disease: iron low, TIBC low, saturation normal, ferritin high.
- Haemochromatosis: saturation > 45%, ferritin high.
- Draw fasting morning; pause supplements 24–48 h before.
- Ferritin is the first-line test — full panel adds value when the picture is unclear.
References
3 sources- BSHIron Deficiency Guidelines
UK haematology guideline.
b-s-h.org.uk
- AASLDHereditary Hemochromatosis
US iron overload guideline.
aasld.org
- WHOAssessing Iron Status
International iron status framework.
who.int
Related articles
 Laboratory Tests
TSH Test: Normal Range, High, Low & What Your Result Actually Means
TSH is the single most important thyroid number. Understand normal ranges by age and pregnancy, what a high or low value really tells you, and the two follow-up tests that clinch the diagnosis.
 Laboratory Tests
HbA1c Test: Normal Range, Prediabetic, Diabetic Cut-offs & How to Lower It
HbA1c reflects your average blood sugar over ~3 months. Understand every threshold — normal, prediabetes, diabetes — and the realistic actions that move the number.
 Laboratory Tests
LDL Cholesterol: Optimal Numbers, High Numbers, and How to Read Yours
LDL is the "bad" cholesterol only if you leave the story there. Understand optimal targets by risk group, the ApoB perspective, and the interventions that actually shift the number.