Understanding BMI in 2026: Beyond the Single Number
BMI is a starting point, not a verdict. Here is how to interpret it with body fat %, waist-to-height and lifestyle context.
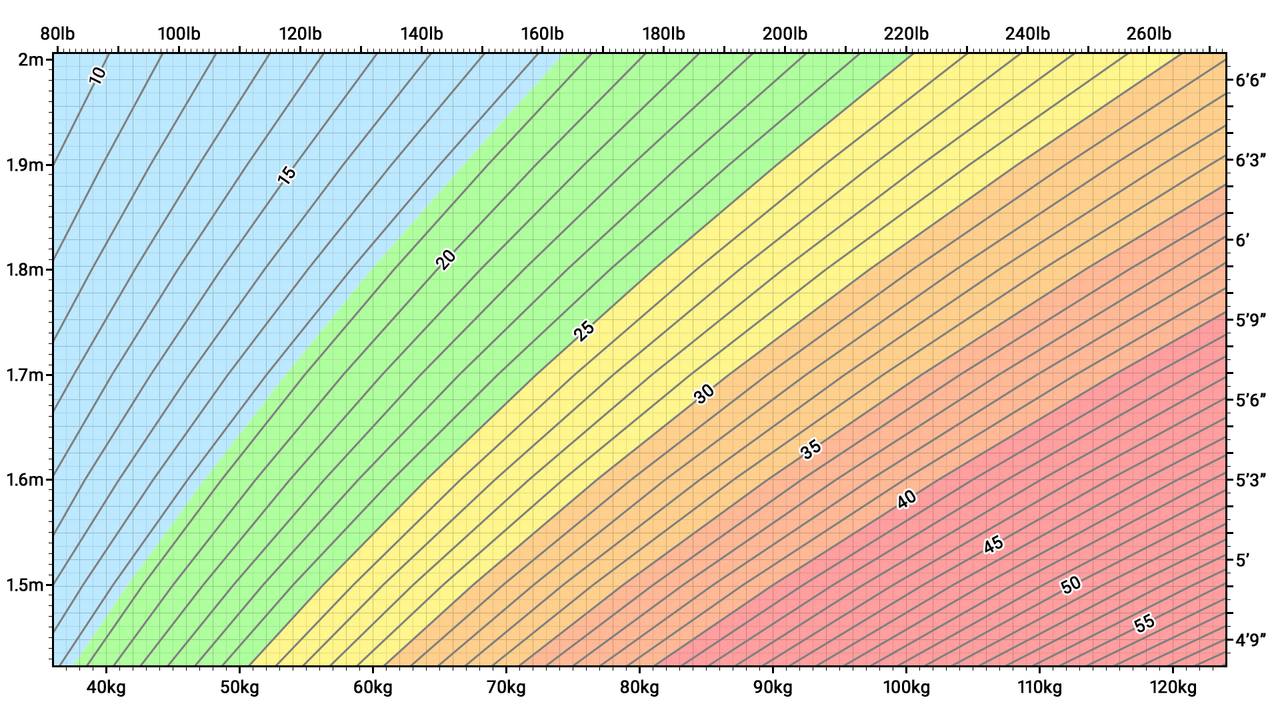
BMI is weight (kg) divided by height (m) squared. It is a population-level screening tool — useful between 18.5 and 30 for most adults, misleading for athletes, older adults, and lower for South Asian populations. Combine BMI with a waist-to-height ratio under 0.5 and a body-fat percentage in the healthy range for a real body-composition picture.
BMI equals weight in kilograms divided by height in metres squared. WHO categories are: under 18.5 underweight, 18.5–24.9 normal, 25–29.9 overweight, ≥30 obesity. The WHO Asian range shifts overweight to ≥23 and obesity to ≥27.5. BMI does not distinguish fat from muscle — waist-to-height ratio under 0.5 and body-fat percentage are the two metrics that complete the picture.
- Formula
- weight (kg) ÷ height (m)²
- Healthy range (WHO adult)
- 18.5 – 24.9 kg/m²
- Overweight
- 25.0 – 29.9 kg/m²
- Obesity class I / II / III
- 30.0–34.9 / 35.0–39.9 / ≥ 40 kg/m²
- Asian population cut-off (WHO)
- Overweight ≥ 23, obesity ≥ 27.5
- Best paired with
- Waist-to-height ratio (< 0.5) + body-fat %
A number, in context
Body Mass Index turns 200 years old in 2032. Adolphe Quetelet designed it in the 1830s as a population statistic — never as a personal verdict — and yet here it sits, on every clinic intake form on the planet.
In 2026, the consensus is unchanged but better understood: BMI is a useful starting point that flattens variation. Two adults of the same height and weight can sit in the same BMI bucket with vastly different body composition, cardiometabolic risk, and lived experience of their bodies.
Where BMI shines
For most adults between 20 and 60, BMI tracks population-level health outcomes well. Below 18.5 and above 30 it correlates with measurable risk shifts in dozens of large cohort studies.
It is cheap, requires no equipment beyond a scale and a tape measure, and is reproducible by anyone, anywhere. That accessibility is genuinely valuable.
Where BMI fails
Muscular athletes are routinely classified as overweight. Older adults with sarcopenia look "normal" while losing functional muscle. South Asian populations show metabolic risk at lower BMI thresholds than Caucasian populations — the WHO now publishes ethnicity-adjusted ranges.
A single number cannot tell you about fat distribution, which matters more than total fat. Visceral fat around the organs carries far more risk than subcutaneous fat on the hips and thighs.
Better questions to pair with BMI
Waist-to-height ratio is arguably more useful day-to-day: keep your waist under half your height. A skinfold or DEXA-derived body-fat percentage gives the composition picture. Resting heart rate, sleep quality, and lift / walk metrics all add detail that a scale cannot.
The most modern framing: BMI is the headline; body composition and lifestyle metrics are the article.
BMI vs the two metrics you should pair with it
| Metric | What it captures | Best when | Limitation |
|---|---|---|---|
| BMI | Weight relative to height | Population screening; adults 18.5–29.9 | Cannot tell fat from muscle |
| Waist-to-height ratio | Central / visceral fat pattern | Any adult; especially BMI 23–30 | Requires accurate tape measure |
| Body-fat % | Fat mass vs lean mass | Athletes, older adults, sarcopenia risk | Method-dependent (DEXA > BIA > calipers) |
Frequently asked questions
- BMI is a population screening tool, not a personal verdict.
- Healthy range for most adults: 18.5 – 24.9 kg/m² (WHO).
- For South Asians and East Asians, the WHO shifts overweight to ≥ 23.
- BMI cannot separate fat from muscle — pair it with waist-to-height and body-fat %.
- Best next step: keep your waist-to-height ratio under 0.5.
Related articles
 Body Measurements
Waist-to-Height: The Vital Sign That Outperforms BMI
A tape measure and one ratio reveal more about your metabolic risk than the bathroom scale ever could.
 Body Measurements
Lean Body Mass: The Metric Behind Every Calorie Calculation
Forget your weight. The number that quietly drives your BMR, your protein needs and your training results is the lean mass underneath.
 Lab Interpretation
Vitamin D Deficiency: When Low Numbers Actually Matter
A "low" vitamin D result is not always a real deficiency, and not every low result needs treatment. Here is how clinicians actually decide.