Diabetes · Lab conversion

HbA1c ↔ eAG Converter Calculator

Convert HbA1c to estimated average glucose (mg/dL and mmol/L).

Your details

I know my

Enter the value from your latest laboratory report. This converter provides an estimate, not a diagnosis. It does not replace a laboratory HbA1c or professional interpretation.

HbA1c
5.7%
< 5.7 %≥ 6.5 %
Falls within the commonly used HbA1c interpretation range labelled prediabetes

An HbA1c between 5.7% and 6.4% (39–47 mmol/mol) falls within the commonly used interpretation range that the ADA labels "prediabetes". This is a screening range, not a diagnosis — the label describes the number, not the person, and interpretation belongs with a clinician.

Every unit
HbA1c (DCCT)
5.7 %
HbA1c (IFCC)
39 mmol/mol
eAG
117 mg/dL
eAG
6.5 mmol/L

What is eAG?

Estimated Average Glucose (eAG) is a way to express HbA1c in the same units as a daily glucose meter (mg/dL or mmol/L). The relationship was validated by the ADAG study (Nathan 2008) across 507 adults with continuous glucose monitoring, and is now used across most international diabetes reports.

The ADAG conversion formula

eAG (mg/dL) = 28.7 × HbA1c (%) − 46.7. mmol/L = mg/dL ÷ 18.02. To convert HbA1c between % (DCCT) and mmol/mol (IFCC): mmol/mol = (% − 2.15) × 10.929. Every conversion above uses these exact equations — no rounding shortcuts.

Going from eAG back to HbA1c

The same equation reversed gives HbA1c (%) = (eAG mg/dL + 46.7) / 28.7. Use the toggle at the top of this tool to enter eAG directly and get your equivalent HbA1c.

When HbA1c can be misleading

HbA1c reflects a weighted average of red-cell glucose exposure over ~2-3 months. Conditions that shorten or lengthen red-cell lifespan (haemolytic anaemia, iron-deficiency anaemia, recent transfusion, some haemoglobinopathies) can bias the result. Continuous glucose monitoring (CGM) or fructosamine may be preferred — a clinician can decide.

Category reference

CategoryRange
Below the screening range< 5.7 % (< 39 mmol/mol)
Screening range labelled prediabetes5.7 – 6.4 % (39 – 47 mmol/mol)
At or above the diabetes reference threshold≥ 6.5 % (≥ 48 mmol/mol)

Limitations & caveats

  • HbA1c reflects average glucose exposure over the preceding weeks — a single value cannot show hypoglycaemia, post-meal spikes or day-to-day variability.
  • Anaemia, iron deficiency, haemoglobin variants, recent blood loss, recent transfusion and pregnancy may distort HbA1c and interpretation.
  • Chronic kidney disease and altered red-blood-cell turnover can affect the value independently of glucose exposure.
  • Interpretation ranges are commonly used clinical references, not a diagnosis on their own; laboratories and clinicians may apply context-specific targets.
  • The ADAG regression was derived in adults; paediatric populations may show slightly different relationships and specialist targets may apply.
  • HbA1c does not replace clinical judgement and cannot identify the type or cause of any condition.
FAQ

Frequently asked questions

Related tools

Keep exploring

Read more

Read up on the science

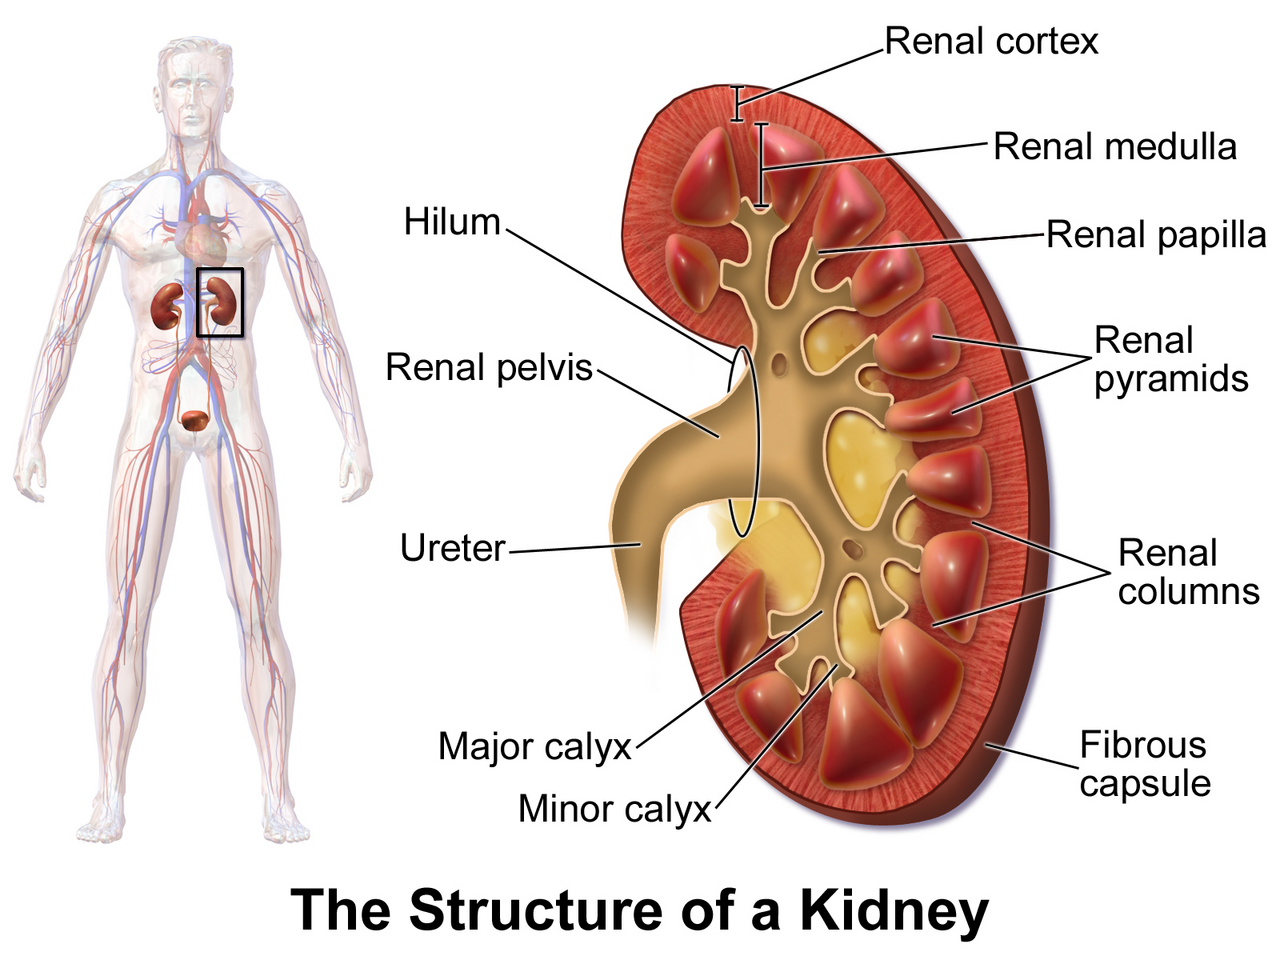
Kidney anatomy and nephron
Kidney Function & Electrolytes
Jul 20, 2026 9 min read

Creatinine and eGFR: What These Kidney Function Results Mean Together

Understand what creatinine and estimated GFR (eGFR) measure, why eGFR is a calculated estimate rather than a direct measurement, and why one result cannot diagnose chronic kidney disease on its own.

By Elements84 Editorial Team
Read
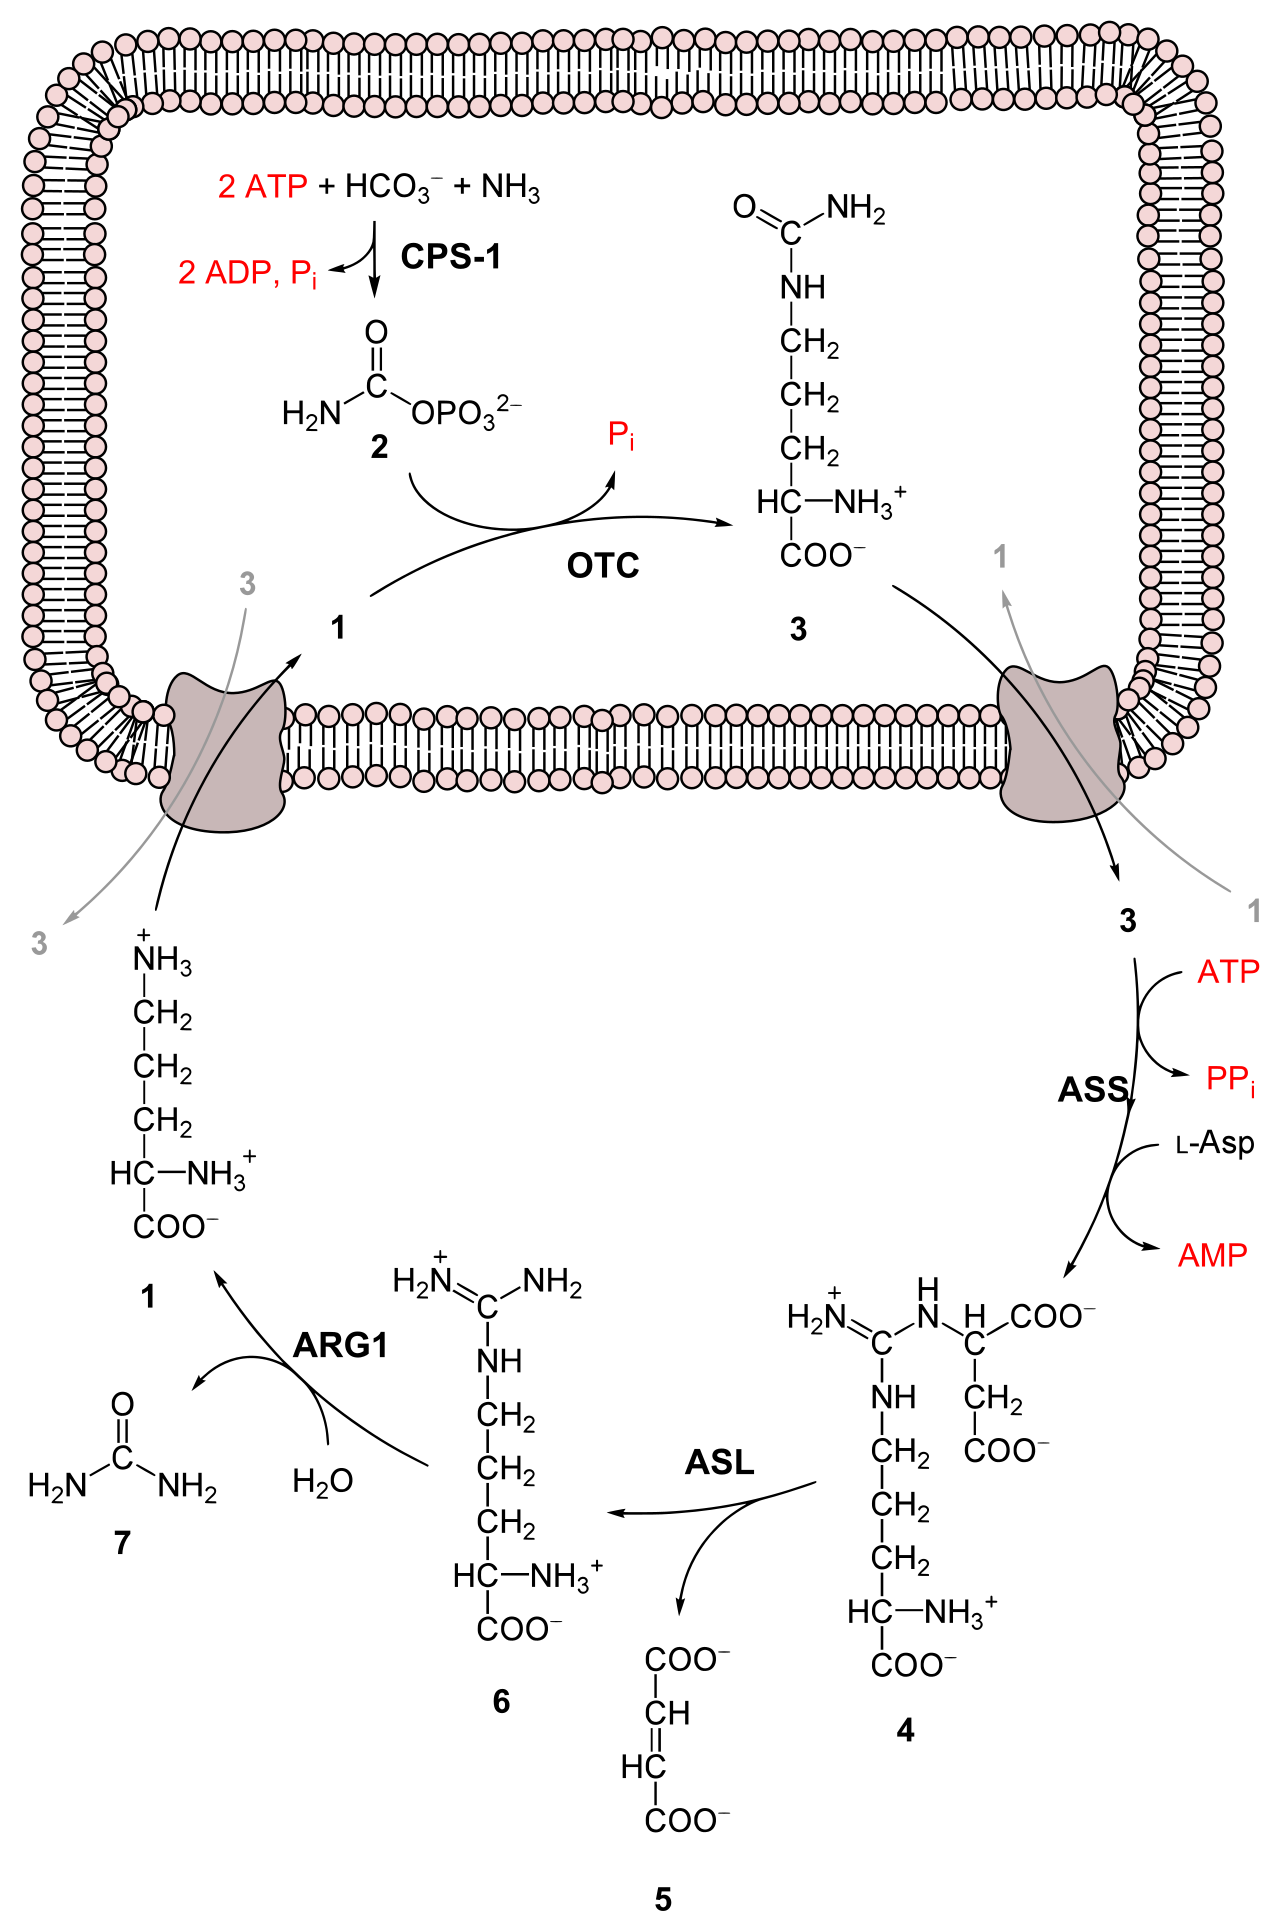
Urea cycle in nitrogen excretion
Kidney Function & Electrolytes
Jul 20, 2026 8 min read

BUN Blood Test Explained: What High and Low Results Can Mean

Learn what blood urea nitrogen (BUN) measures, why it can rise for reasons unrelated to kidney filtration, and why the BUN-to-creatinine ratio adds context a single BUN value can't.

By Elements84 Editorial Team
Read
Urine test strip for albumin and other markers
Kidney Function & Electrolytes
Jul 20, 2026 9 min read

Urine Albumin-to-Creatinine Ratio: An Early Kidney-Damage Test Explained

Learn why urine albumin-to-creatinine ratio (uACR) can detect kidney damage before eGFR falls, how the A1/A2/A3 categories work, and what can cause a falsely elevated result.

By Elements84 Editorial Team
Read
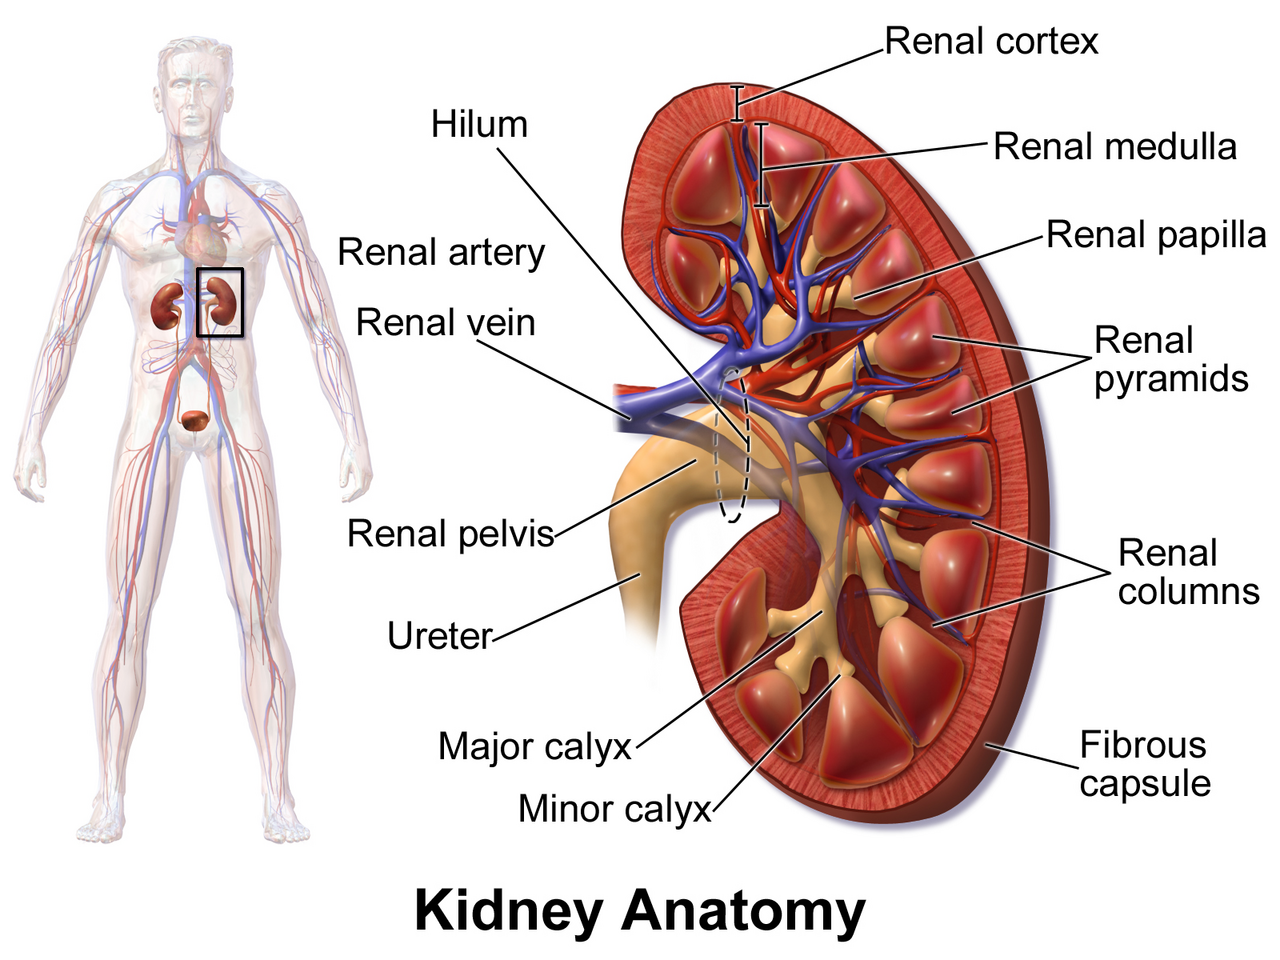
Kidney nephron structure
Kidney Function & Electrolytes
Jul 20, 2026 8 min read

Cystatin C Blood Test: When It Adds Useful Information Beyond Creatinine

Learn what cystatin C measures, why it's less affected by muscle mass than creatinine, and when guidelines recommend using it to confirm a borderline eGFR result.

By Elements84 Editorial Team
Read
Practical decision

What "Falls within the commonly used HbA1c interpretation range labelled prediabetes" means

HbA1c reflects the amount of glucose that has become attached to haemoglobin inside red blood cells, and estimates average glucose exposure over the preceding weeks. Estimated Average Glucose (eAG) translates that HbA1c into the glucose units used by home meters and continuous monitors, which many people find easier to read. This converter uses the ADAG formula (Nathan 2008): eAG mg/dL = 28.7 × HbA1c% − 46.7. The converted value is an estimate — individual glucose patterns may differ from the calculated eAG.

What to do next

Use the converted value to make the same laboratory result easier to read alongside home glucose readings — not as a stand-alone health verdict. Confirm the source unit (HbA1c % or mmol/mol) and output unit (mg/dL or mmol/L), compare trends using results from the same laboratory where practical, and discuss unexpected or concerning values with a qualified healthcare professional. Do not change medication, insulin or any treatment based on this converter alone.

This converter provides an estimate, not a diagnosis or treatment recommendation. Medication or insulin changes should only be made with a qualified healthcare professional.

What the formula measures
  • Conversion between HbA1c (% DCCT and mmol/mol IFCC) and estimated average glucose (mg/dL and mmol/L)
  • A translation of a single laboratory value into more familiar glucose units
  • A signal that reflects average glucose exposure over the preceding weeks
What it does not measure
  • Daily glucose variability
  • Hypoglycaemia (low glucose episodes)
  • Post-meal glucose spikes
  • Fasting blood glucose
  • Current blood glucose at the moment of testing
  • Individual red-blood-cell lifespan or turnover
  • The effectiveness of any specific medication on its own
  • The presence, type or severity of any condition
Where it does not apply
  • Pregnancy — interpretation and monitoring approaches may differ; discuss with a qualified healthcare professional
  • Anaemia (including iron deficiency) — can distort HbA1c readings
  • Haemoglobin variants (e.g. HbS, HbC, HbE) — may affect the accuracy of some HbA1c assays
  • Recent blood loss — can lower HbA1c independently of glucose exposure
  • Recent blood transfusion — introduces donor red cells and can shift the value
  • Chronic kidney disease — altered red-cell turnover can influence HbA1c
  • Conditions with altered red-blood-cell turnover (haemolysis, splenectomy, some medications)
  • Children and adolescents — specialist targets and interpretation may apply
How to measure correctly
  • Confirm whether your source value is HbA1c in % (DCCT) or mmol/mol (IFCC)
  • Confirm whether you want the glucose output in mg/dL or mmol/L
  • Enter the laboratory value exactly as reported — no rounding
  • Do not substitute a single finger-stick glucose reading — this converter is for laboratory HbA1c only
  • Compare the converted value with your original laboratory report and any prior results from the same laboratory
Clinical Interpretation

Falls within the commonly used HbA1c interpretation range labelled prediabetesBorderline

An HbA1c between 5.7% and 6.4% (39–47 mmol/mol) falls within the commonly used interpretation range that the ADA labels "prediabetes". This is a screening range, not a diagnosis — the label describes the number, not the person, and interpretation belongs with a clinician.

Common causes
  • Average glucose exposure over the preceding weeks appears above the reference range but below the diabetes threshold
  • Insulin resistance and central adiposity are commonly discussed contributors
  • Sedentary time, sleep disruption and dietary quality can influence the trajectory
Lifestyle considerations
  • Structured lifestyle programmes are the mainstay of guidance at this range
  • Fibre-rich meals with protein at each sitting can support satiety
  • Combining aerobic activity with resistance training is often recommended
  • Sleep quality supports glycaemic regulation
When to consult a healthcare professional

Please consider discussing this result with a qualified healthcare professional. A repeat HbA1c or additional tests may be appropriate, and formal prevention programmes may be available in your region.

Medical Evidence

How we ground the HbA1c ↔ eAG Converter

Grade A · Clinical guidelines & meta-analysesLast reviewed Feb 12, 2026
Named clinical guidelines
  • Nathan DM et al. (2008) A1C-Derived Average Glucose (ADAG) study — Diabetes Care 31(8):1473-1478
  • American Diabetes Association — Standards of Medical Care in Diabetes 2024, §2 Classification and Diagnosis
  • WHO / IFCC — HbA1c reporting standardisation (mmol/mol)

The Evidence Foundation

Health information should show both what is known and where certainty ends.

Elements84 brings reviewed health evidence, practical decision tools and plain-English explanations together without presenting educational guidance as diagnosis or treatment.

  1. Named sources
  2. Human evidence separated from theory
  3. Limitations shown beside conclusions
  4. Educational, not diagnostic

Reviewed health evidence, practical decision tools and plain-English health education.

Educational information only. Elements84 provides educational information and decision-support tools. It is not a substitute for professional medical advice, diagnosis or treatment.

© 2026 Elements84.