Diabetes · Insulin resistance

HOMA-IR Calculator

Homeostatic Model Assessment of Insulin Resistance — from fasting insulin and glucose.

Your details

Fasting glucose

Both values must be from the SAME fasting blood sample for the formula to be valid.

HOMA-IR
1.33
< 1≥ 3
Within normal range

A HOMA-IR between 1.0 and 1.9 is commonly within reference range in adult populations, though cut-offs vary by assay and ethnicity.

Your numbers
Fasting insulin
6 µU/mL
Fasting glucose
90 mg/dL
Fasting glucose
5.0 mmol/L
HOMA-β (β-cell function)
81 %

HOMA-β is a companion proxy for pancreatic β-cell function from the same Matthews 1985 model. It is not diagnostic — reference ranges vary by assay and population.

What HOMA-IR measures

HOMA-IR (Homeostatic Model Assessment of Insulin Resistance) estimates whole-body insulin resistance from a single fasting blood draw of insulin and glucose. It was developed by Matthews et al. (1985) at Oxford as a research tool and has since become a common lightweight clinical proxy for insulin sensitivity, though the gold standard remains the euglycaemic-hyperinsulinaemic clamp.

The formula

HOMA-IR = (Fasting Insulin [µU/mL] × Fasting Glucose [mg/dL]) / 405. When glucose is given in mmol/L, the denominator becomes 22.5. Both are mathematically equivalent — 405 ≈ 22.5 × 18.02.

Why fasting matters

The model assumes the body is in steady-state — no recent carbohydrate load, no physiological stress. That’s why both samples must be drawn after ≥ 8 hours of fasting from the SAME blood draw. A non-fasting HOMA-IR is not interpretable.

Not a diagnosis — a screening lens

HOMA-IR is not a diagnostic test for diabetes and there is no universal cut-off. Reference ranges vary by assay and ethnicity (Ascaso 2003 identified ~2.6 as the 90th percentile in a Spanish cohort; other cohorts differ). Treat the number as a lens for a clinician conversation — never as a label.

Category reference

CategoryRange
Optimal insulin sensitivity< 1.0
Within normal range1.0 – 1.9
Mild-to-moderate IR likely2.0 – 2.9
Significant IR likely≥ 3.0

Limitations & caveats

  • Not valid in people receiving exogenous insulin therapy.
  • Not valid in overt type 1 diabetes (severely low endogenous insulin).
  • Assay-dependent — insulin measurement varies between labs, so cut-offs shift too.
  • Cannot distinguish hepatic vs. peripheral insulin resistance.
  • A single value can be affected by illness, corticosteroid use, or a recent large carbohydrate load.
FAQ

Frequently asked questions

Related tools

Keep exploring

Read more

Read up on the science

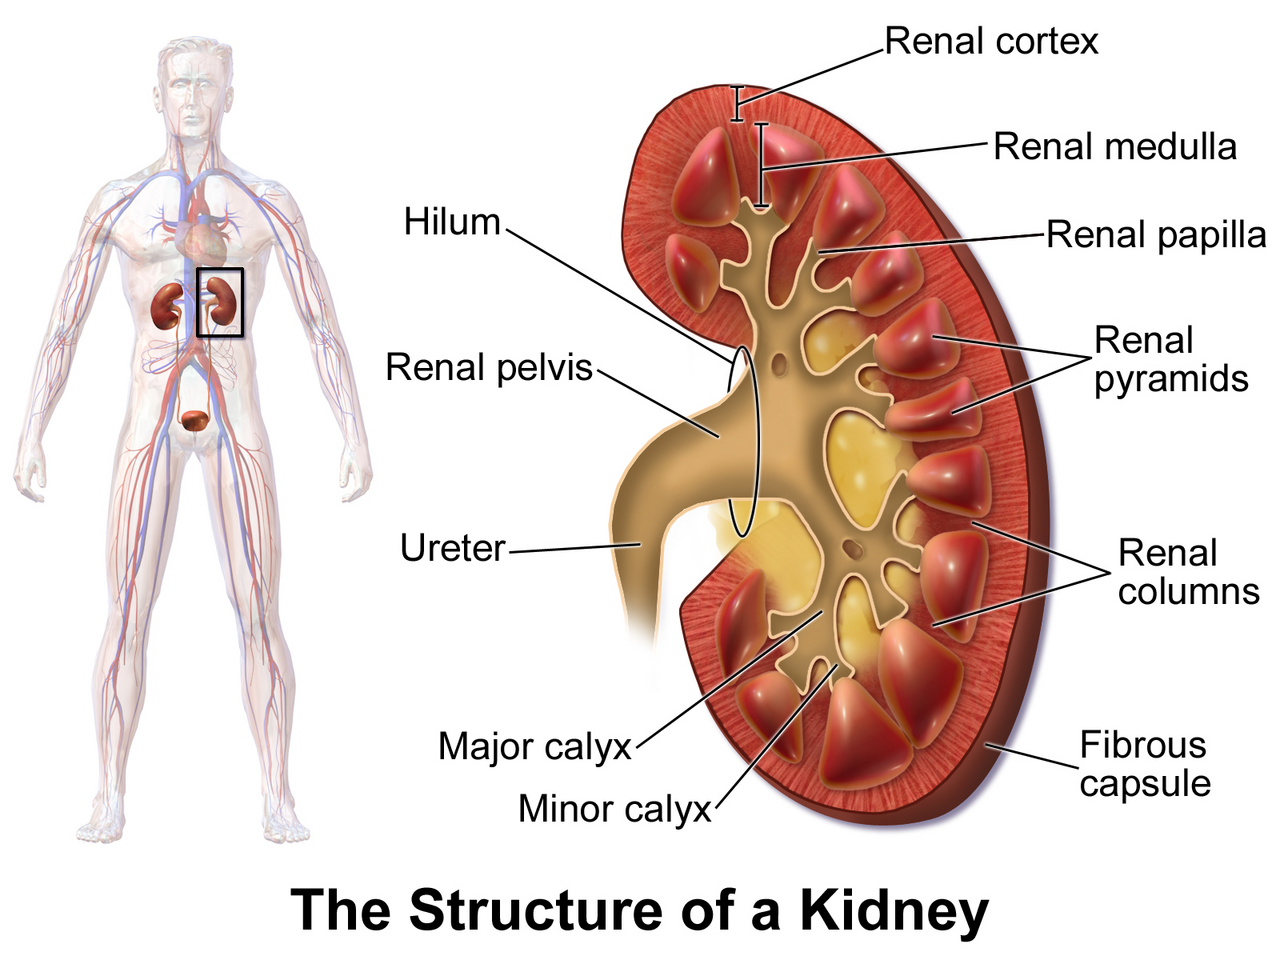
Kidney anatomy and nephron
Kidney Function & Electrolytes
Jul 20, 2026 9 min read

Creatinine and eGFR: What These Kidney Function Results Mean Together

Understand what creatinine and estimated GFR (eGFR) measure, why eGFR is a calculated estimate rather than a direct measurement, and why one result cannot diagnose chronic kidney disease on its own.

By Elements84 Editorial Team
Read
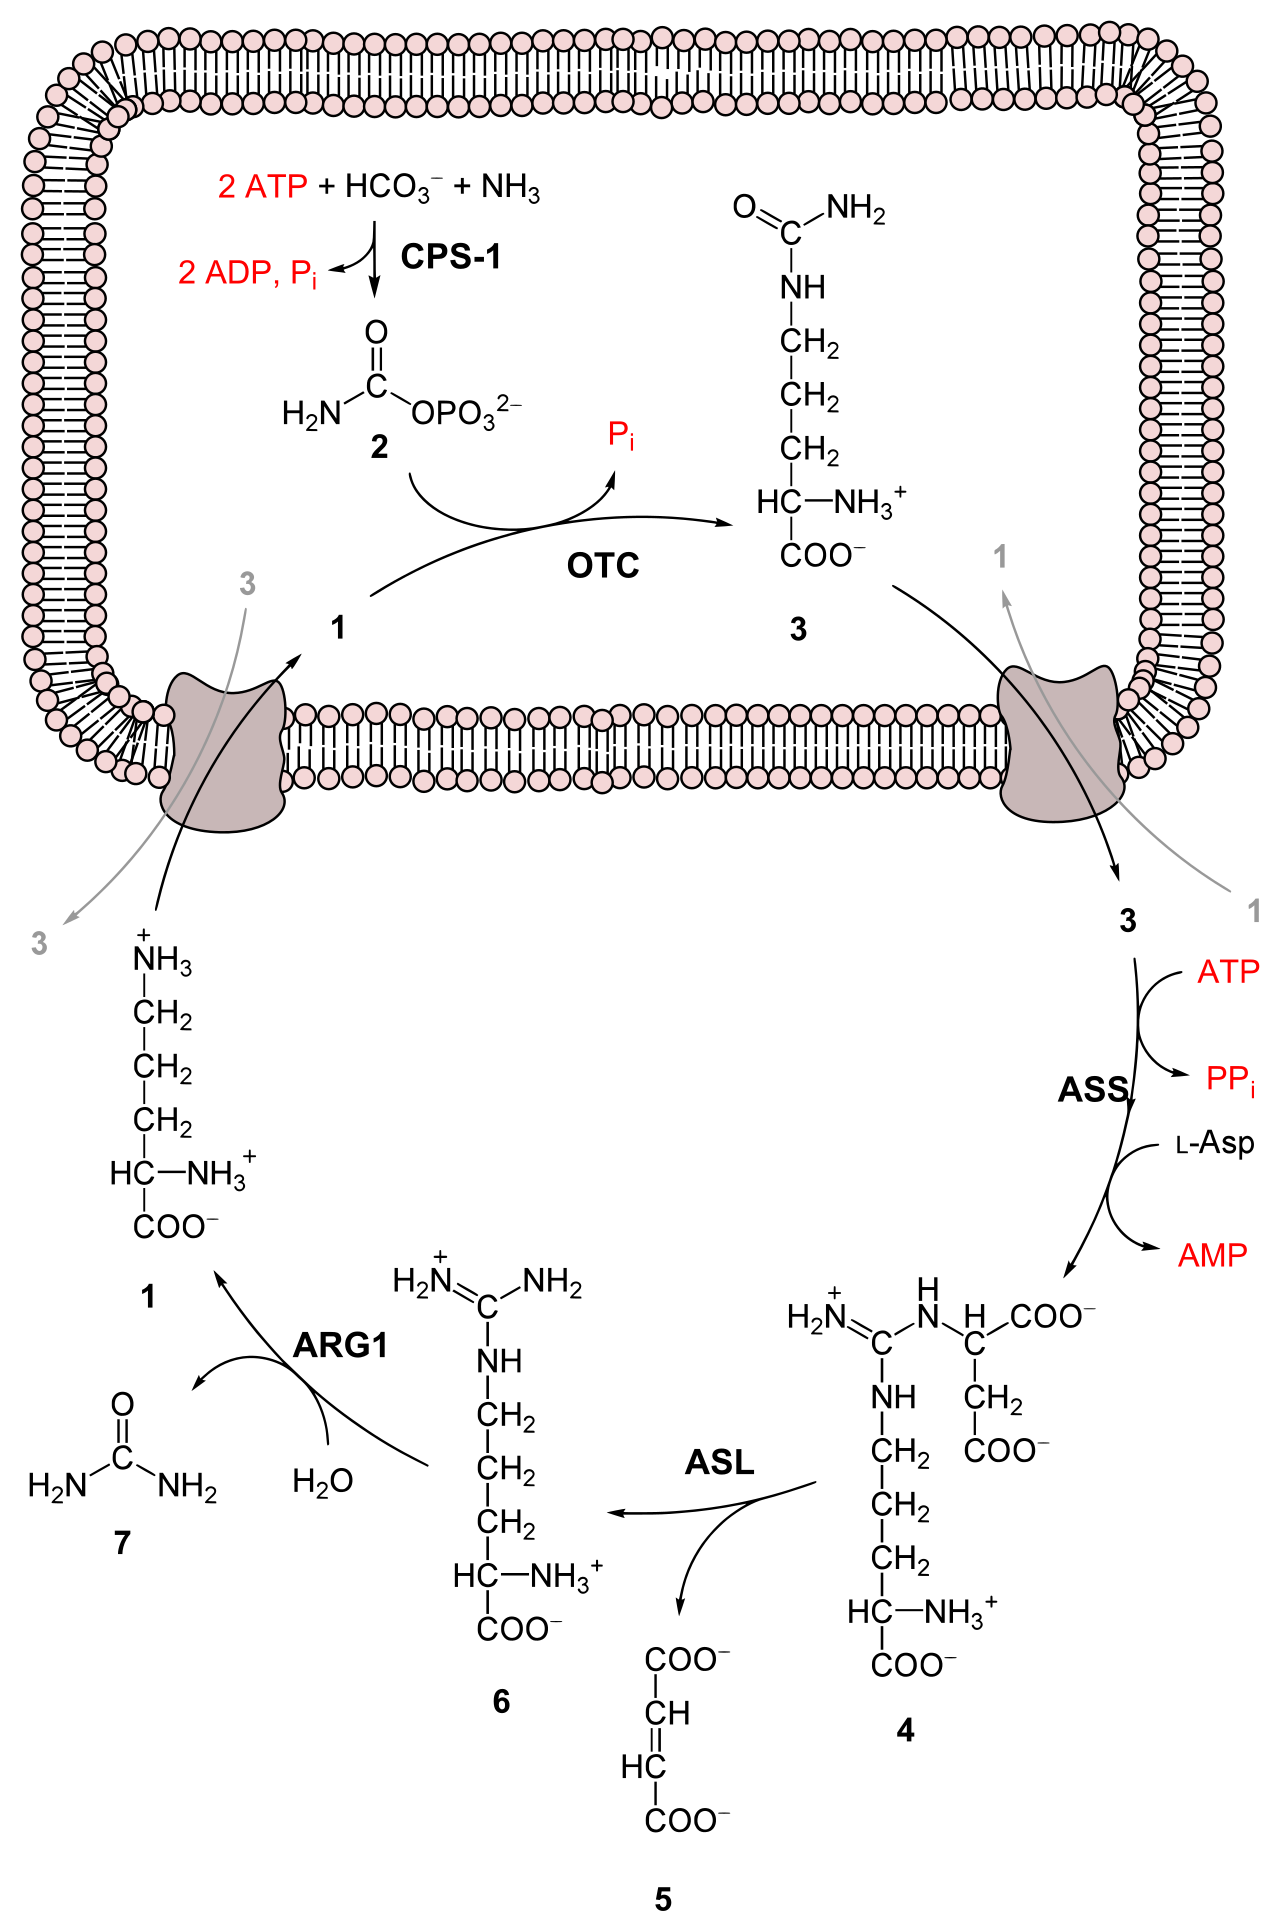
Urea cycle in nitrogen excretion
Kidney Function & Electrolytes
Jul 20, 2026 8 min read

BUN Blood Test Explained: What High and Low Results Can Mean

Learn what blood urea nitrogen (BUN) measures, why it can rise for reasons unrelated to kidney filtration, and why the BUN-to-creatinine ratio adds context a single BUN value can't.

By Elements84 Editorial Team
Read
Urine test strip for albumin and other markers
Kidney Function & Electrolytes
Jul 20, 2026 9 min read

Urine Albumin-to-Creatinine Ratio: An Early Kidney-Damage Test Explained

Learn why urine albumin-to-creatinine ratio (uACR) can detect kidney damage before eGFR falls, how the A1/A2/A3 categories work, and what can cause a falsely elevated result.

By Elements84 Editorial Team
Read
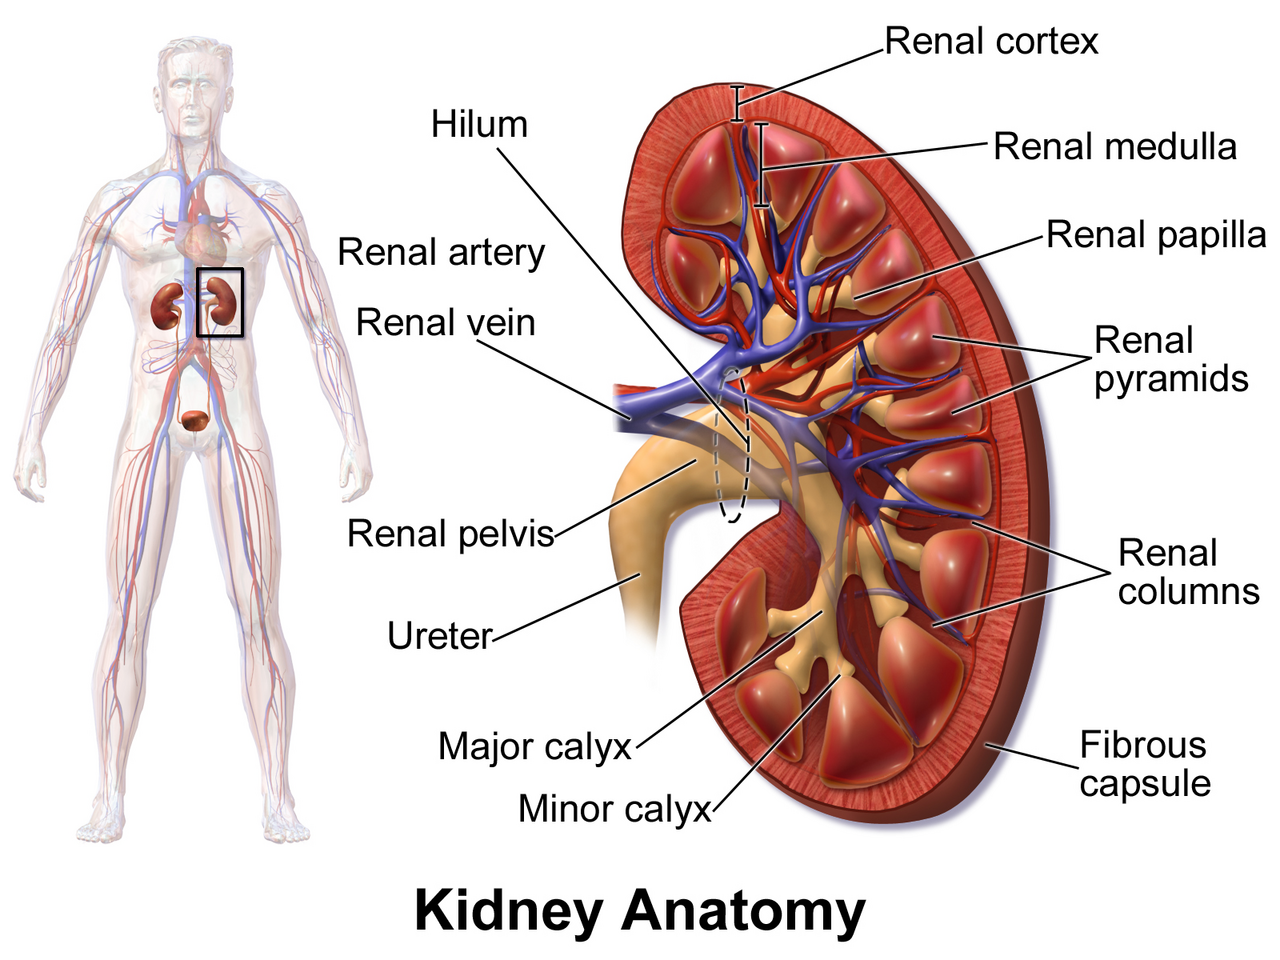
Kidney nephron structure
Kidney Function & Electrolytes
Jul 20, 2026 8 min read

Cystatin C Blood Test: When It Adds Useful Information Beyond Creatinine

Learn what cystatin C measures, why it's less affected by muscle mass than creatinine, and when guidelines recommend using it to confirm a borderline eGFR result.

By Elements84 Editorial Team
Read
Clinical Interpretation

Within normal rangeNormal

A HOMA-IR between 1.0 and 1.9 is commonly within reference range in adult populations, though cut-offs vary by assay and ethnicity.

Common causes
  • Typical for a metabolically healthy adult population
Lifestyle considerations
  • Protect the routines you already have
  • Focus on sustainable movement + protein + sleep basics
When to consult a healthcare professional

Routine follow-up with your clinician per usual — no specific action from this value.

Medical Evidence

How we ground the HOMA-IR

Grade A · Clinical guidelines & meta-analysesLast reviewed Feb 12, 2026
Named clinical guidelines
  • Matthews DR et al. (1985) Diabetologia — original HOMA description
  • Ascaso JF et al. (2003) Diabetes Care — HOMA-IR cut-offs in a Spanish population
  • Bonora E et al. (2000) Diabetes Care — HOMA-IR validation vs. euglycaemic clamp

The Evidence Foundation

Health information should show both what is known and where certainty ends.

Elements84 brings reviewed health evidence, practical decision tools and plain-English explanations together without presenting educational guidance as diagnosis or treatment.

  1. Named sources
  2. Human evidence separated from theory
  3. Limitations shown beside conclusions
  4. Educational, not diagnostic

Reviewed health evidence, practical decision tools and plain-English health education.

Educational information only. Elements84 provides educational information and decision-support tools. It is not a substitute for professional medical advice, diagnosis or treatment.

© 2026 Elements84.