Pregnancy · Nutrition

Pregnancy Weight Gain Calculator

Recommended total and weekly gain by pre-pregnancy BMI (IOM 2009 + ACOG 2013).

Your details

Pre-pregnancy weight
Height
Current weight
Pregnancy type

These ranges are population guidance — individual targets are set with your antenatal care team. This tool does not replace clinical care.

Expected gain by this week (mid-range)
4.2kg
On track with IOM guidance for this week

Your current gain sits within the mid-range trajectory of the IOM 2009 guidance for your pre-pregnancy BMI and this gestational week.

Your IOM 2009 breakdown
Pre-pregnancy BMI (normal)
23.9
Total range (IOM)
11.5 – 16 kg (25 – 35 lb)
Weekly rate (T2 / T3)
0.35 – 0.5 kg / week
Expected by week 20 (mid-range)
4.2 kg
Your gain so far
5 kg

Population guidance from IOM 2009 and ACOG 2013. Individual targets are set by your antenatal care team.

What the IOM 2009 guidance is

The Institute of Medicine’s 2009 update to pregnancy weight-gain guidance is the international reference. It sets total-gain ranges by pre-pregnancy BMI category and describes weekly rates for the second and third trimesters. First-trimester gain (0-13 weeks) is small (0.5-2 kg) across all BMI categories.

Why the trajectory matters more than the total

Following a reasonable weekly trajectory is more informative than the total gain alone. A pregnancy that gains most of its weight in a short third-trimester surge has a different physiology than one that gains steadily. The IOM ranges give both a total and a weekly figure for this reason.

Twin pregnancy

IOM 2009 provides provisional ranges for twin pregnancies: 17-25 kg (normal BMI), 14-23 kg (overweight), 11-19 kg (obese). Underweight-BMI twin recommendations are not provided in IOM 2009 and remain clinician-guided.

Not a clinical target

These ranges are population guidance. Your antenatal care team sets your individual targets based on your health, blood pressure, foetal growth, and any complications. Weight is only one of many signals.

Category reference

CategoryRange
Underweight (BMI < 18.5)Total 12.5 – 18 kg (28 – 40 lb)
Normal weight (18.5 – 24.9)Total 11.5 – 16 kg (25 – 35 lb)
Overweight (25 – 29.9)Total 7 – 11.5 kg (15 – 25 lb)
Obese (BMI ≥ 30)Total 5 – 9 kg (11 – 20 lb)

Limitations & caveats

  • IOM ranges are for population guidance — individual targets are set by antenatal care.
  • BMI-based categories do not capture all body-composition variation.
  • Twin ranges are provisional; multi-foetal pregnancies always involve specialist care.
  • Not applicable if a specific weight-gain plan has been set by your clinical team.
FAQ

Frequently asked questions

Related tools

Keep exploring

Read more

Read up on the science

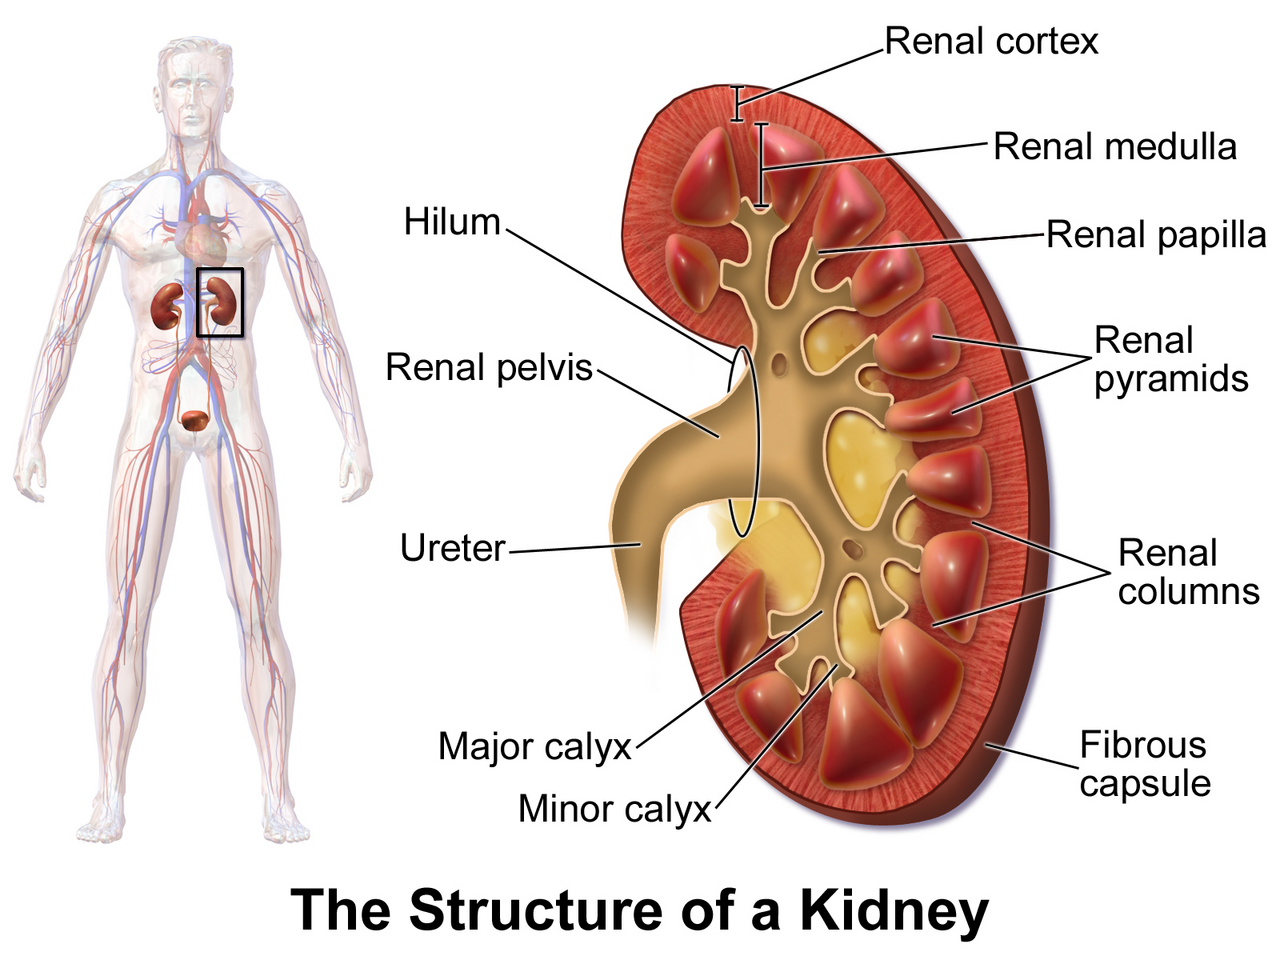
Kidney anatomy and nephron
Kidney Function & Electrolytes
Jul 20, 2026 9 min read

Creatinine and eGFR: What These Kidney Function Results Mean Together

Understand what creatinine and estimated GFR (eGFR) measure, why eGFR is a calculated estimate rather than a direct measurement, and why one result cannot diagnose chronic kidney disease on its own.

By Elements84 Editorial Team
Read
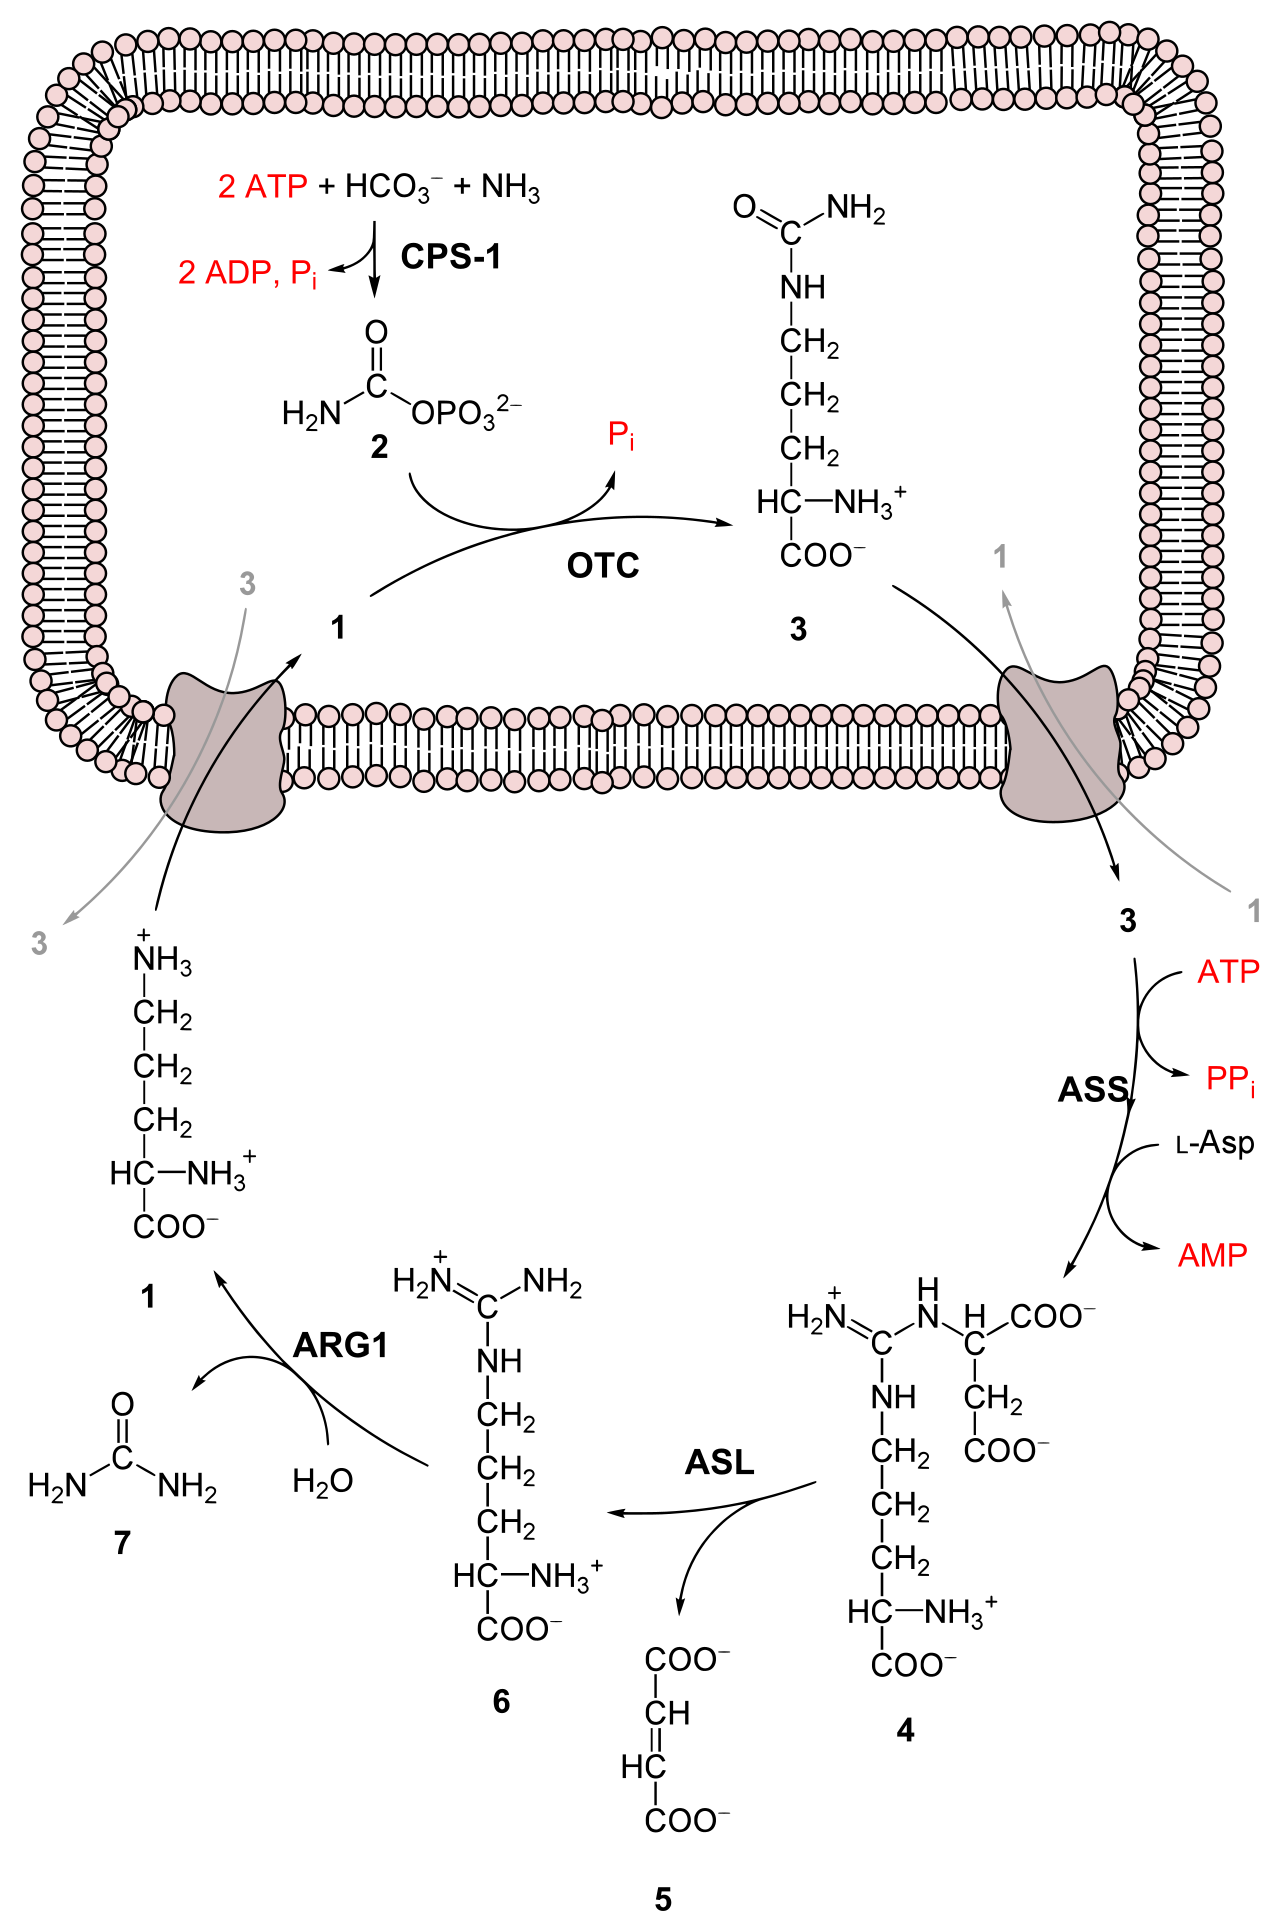
Urea cycle in nitrogen excretion
Kidney Function & Electrolytes
Jul 20, 2026 8 min read

BUN Blood Test Explained: What High and Low Results Can Mean

Learn what blood urea nitrogen (BUN) measures, why it can rise for reasons unrelated to kidney filtration, and why the BUN-to-creatinine ratio adds context a single BUN value can't.

By Elements84 Editorial Team
Read
Urine test strip for albumin and other markers
Kidney Function & Electrolytes
Jul 20, 2026 9 min read

Urine Albumin-to-Creatinine Ratio: An Early Kidney-Damage Test Explained

Learn why urine albumin-to-creatinine ratio (uACR) can detect kidney damage before eGFR falls, how the A1/A2/A3 categories work, and what can cause a falsely elevated result.

By Elements84 Editorial Team
Read
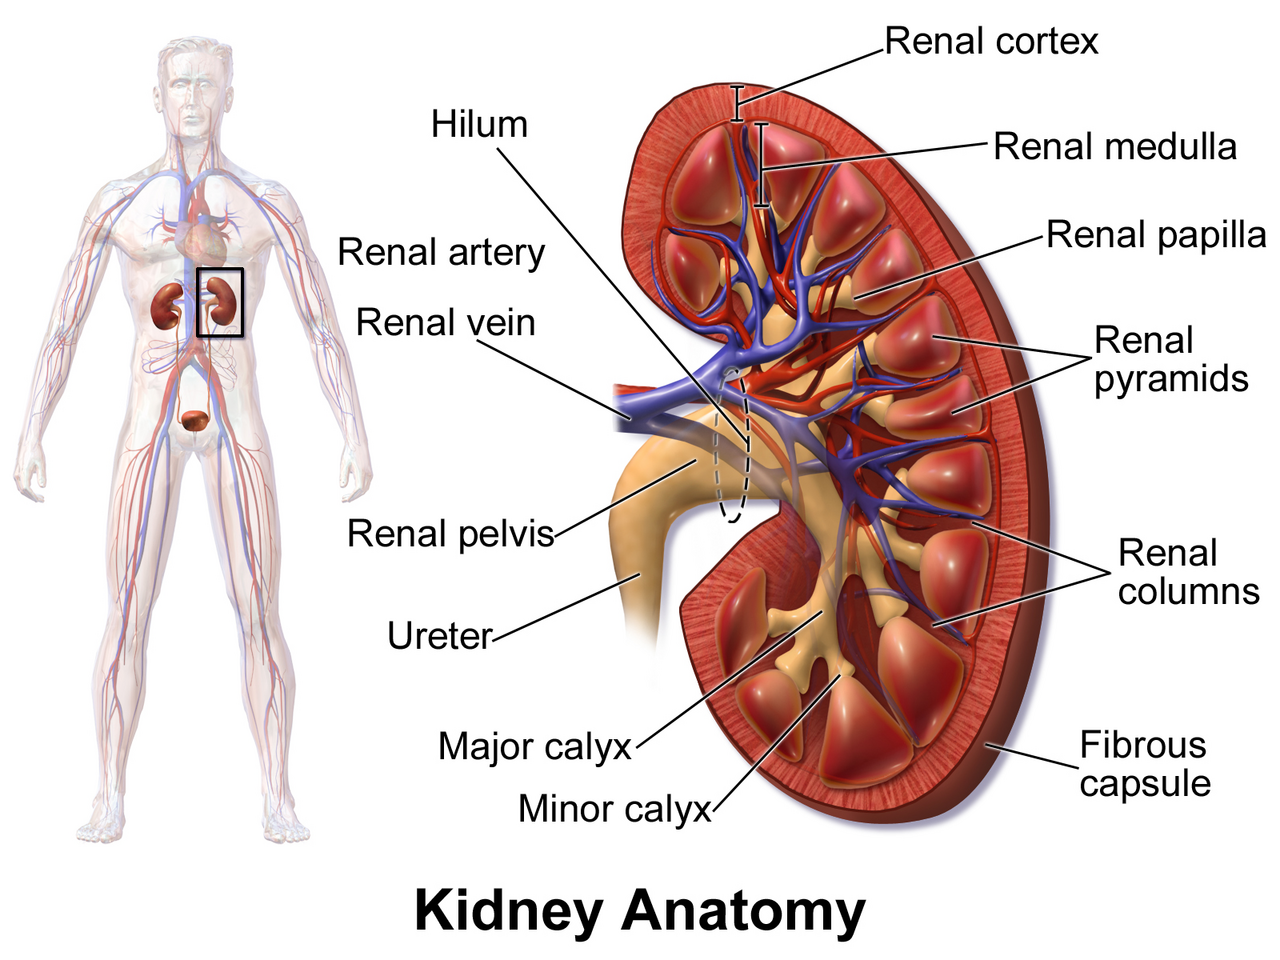
Kidney nephron structure
Kidney Function & Electrolytes
Jul 20, 2026 8 min read

Cystatin C Blood Test: When It Adds Useful Information Beyond Creatinine

Learn what cystatin C measures, why it's less affected by muscle mass than creatinine, and when guidelines recommend using it to confirm a borderline eGFR result.

By Elements84 Editorial Team
Read
Clinical Interpretation

On track with IOM guidance for this weekNormal

Your current gain sits within the mid-range trajectory of the IOM 2009 guidance for your pre-pregnancy BMI and this gestational week.

Common causes
  • Balanced nutrition and typical foetal growth
Lifestyle considerations
  • Continue what you are doing — protein at each meal, adequate hydration, iron and folate intake
  • Aim for 150 minutes/week moderate activity if uncomplicated pregnancy (ACOG 2020)
When to consult a healthcare professional

Continue routine antenatal visits.

Medical Evidence

How we ground the Pregnancy Weight Gain

Grade A · Clinical guidelines & meta-analysesLast reviewed Feb 12, 2026
Named clinical guidelines
  • Institute of Medicine (2009) — Weight Gain During Pregnancy: Reexamining the Guidelines
  • ACOG Committee Opinion 548 (2013, reaffirmed 2020) — Weight Gain During Pregnancy
  • WHO — Recommendations on Antenatal Care (2016)
References

The Evidence Foundation

Health information should show both what is known and where certainty ends.

Elements84 brings reviewed health evidence, practical decision tools and plain-English explanations together without presenting educational guidance as diagnosis or treatment.

  1. Named sources
  2. Human evidence separated from theory
  3. Limitations shown beside conclusions
  4. Educational, not diagnostic

Reviewed health evidence, practical decision tools and plain-English health education.

Educational information only. Elements84 provides educational information and decision-support tools. It is not a substitute for professional medical advice, diagnosis or treatment.

© 2026 Elements84.