Children · Growth

Height Percentile Calculator

CDC 2000 stature-for-age percentile (ages 2-19).

Your details

Biological sex (reference tables)
Height

Growth is a trajectory. One measurement is one point — a paediatrician interprets it alongside parental heights, puberty stage, and general health.

Height-for-age percentile
49.5th percentile
Within reference (3rd–97th percentile)

A height within the 3rd-97th percentile band sits in the CDC reference range for age and sex — where the vast majority of children fall.

CDC 2000 breakdown
Height
138 cm (54.3 in)
Z-score
-0.01
50th percentile height at this age/sex
138.1 cm

Height is largely genetic. Consider the Mid-Parental Height tool alongside this one.

How the percentile is calculated

CDC 2000 uses the LMS method (Cole & Green 1992). At any age and sex, three parameters (L, M, S) allow a z-score to be computed for any height, then a percentile from the standard normal distribution.

Trajectory matters more

Height is strongly determined by genetics. A child who has always tracked at the 20th percentile is following their genetic potential — the concern is not the percentile band, it is the trajectory. A child who drops from the 80th to the 20th over 2-3 years is a different situation.

Mid-parental height

The Mid-Parental Height calculator (another Elements84 tool) estimates a child’s adult height from parental heights. Combined with the current percentile trajectory, it gives context.

Category reference

CategoryRange
Below 3rd percentile< 3rd
Reference band3rd – 97th
Above 97th percentile≥ 97th

Limitations & caveats

  • Yearly interpolation — clinical software uses monthly resolution.
  • Best for ages 2-19.
  • Genetic potential is the strongest driver of height.
  • One measurement is one point.
FAQ

Frequently asked questions

Related tools

Keep exploring

Read more

Read up on the science

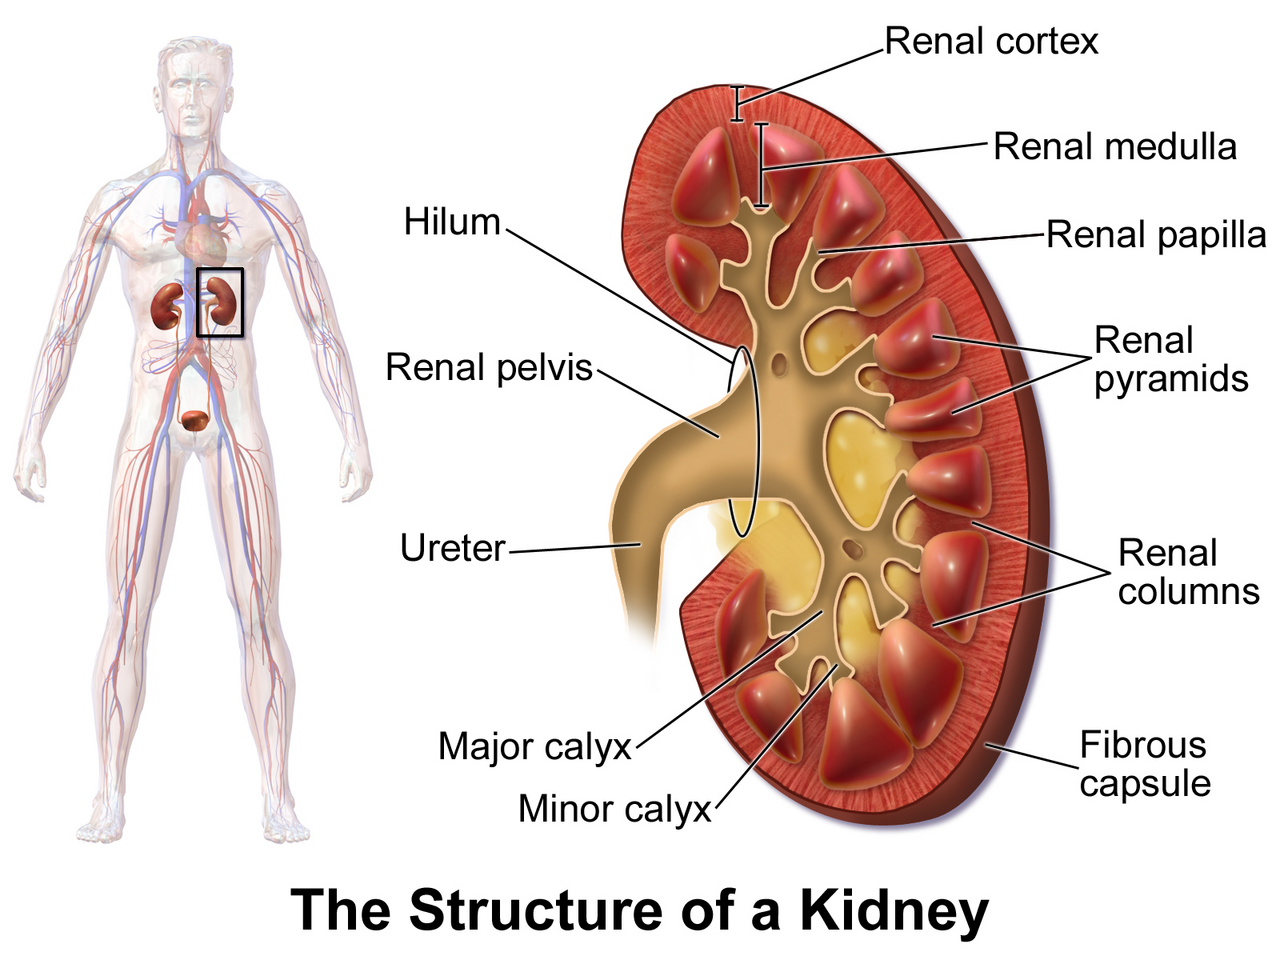
Kidney anatomy and nephron
Kidney Function & Electrolytes
Jul 20, 2026 9 min read

Creatinine and eGFR: What These Kidney Function Results Mean Together

Understand what creatinine and estimated GFR (eGFR) measure, why eGFR is a calculated estimate rather than a direct measurement, and why one result cannot diagnose chronic kidney disease on its own.

By Elements84 Editorial Team
Read
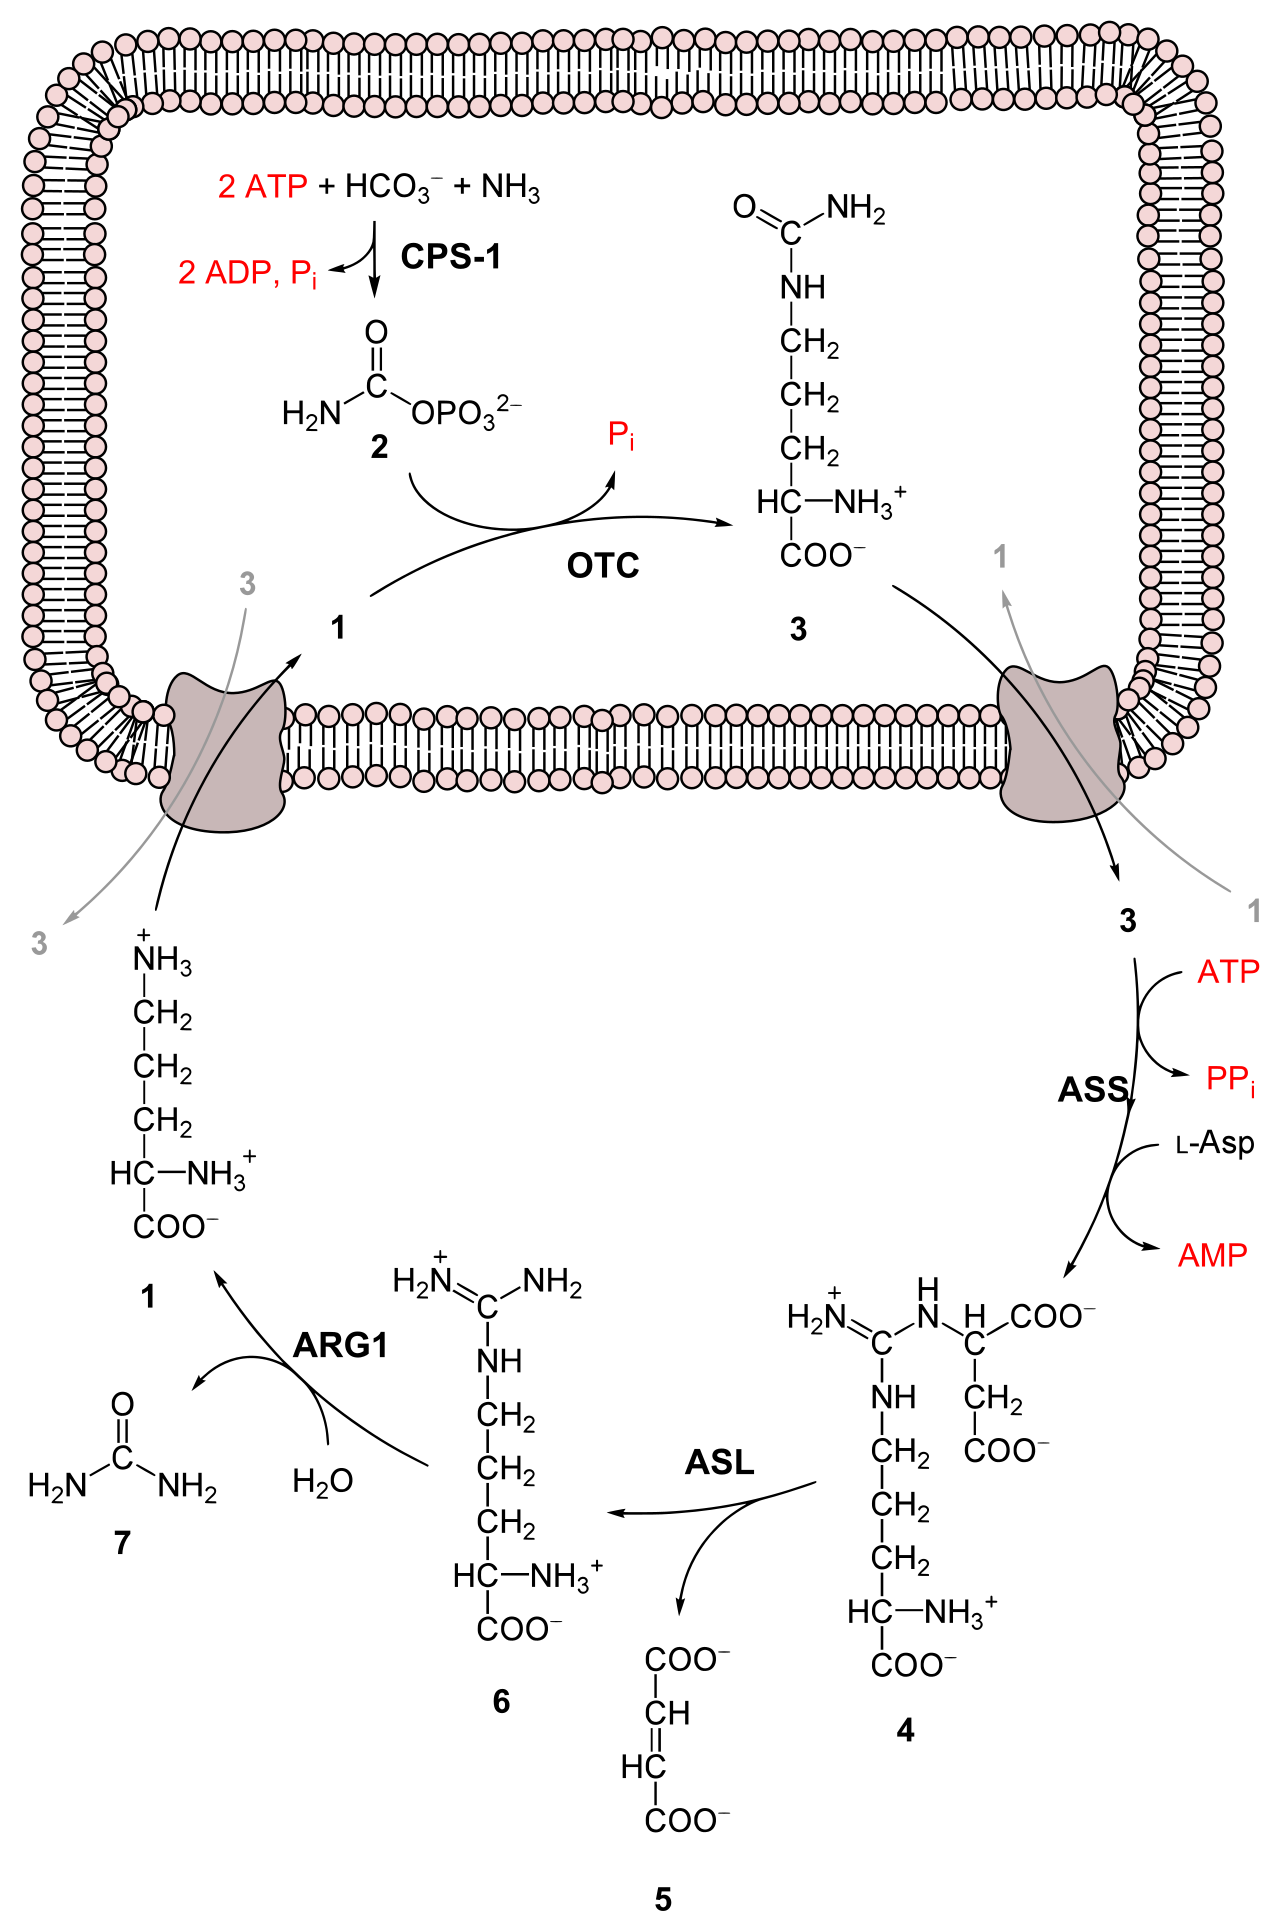
Urea cycle in nitrogen excretion
Kidney Function & Electrolytes
Jul 20, 2026 8 min read

BUN Blood Test Explained: What High and Low Results Can Mean

Learn what blood urea nitrogen (BUN) measures, why it can rise for reasons unrelated to kidney filtration, and why the BUN-to-creatinine ratio adds context a single BUN value can't.

By Elements84 Editorial Team
Read
Urine test strip for albumin and other markers
Kidney Function & Electrolytes
Jul 20, 2026 9 min read

Urine Albumin-to-Creatinine Ratio: An Early Kidney-Damage Test Explained

Learn why urine albumin-to-creatinine ratio (uACR) can detect kidney damage before eGFR falls, how the A1/A2/A3 categories work, and what can cause a falsely elevated result.

By Elements84 Editorial Team
Read
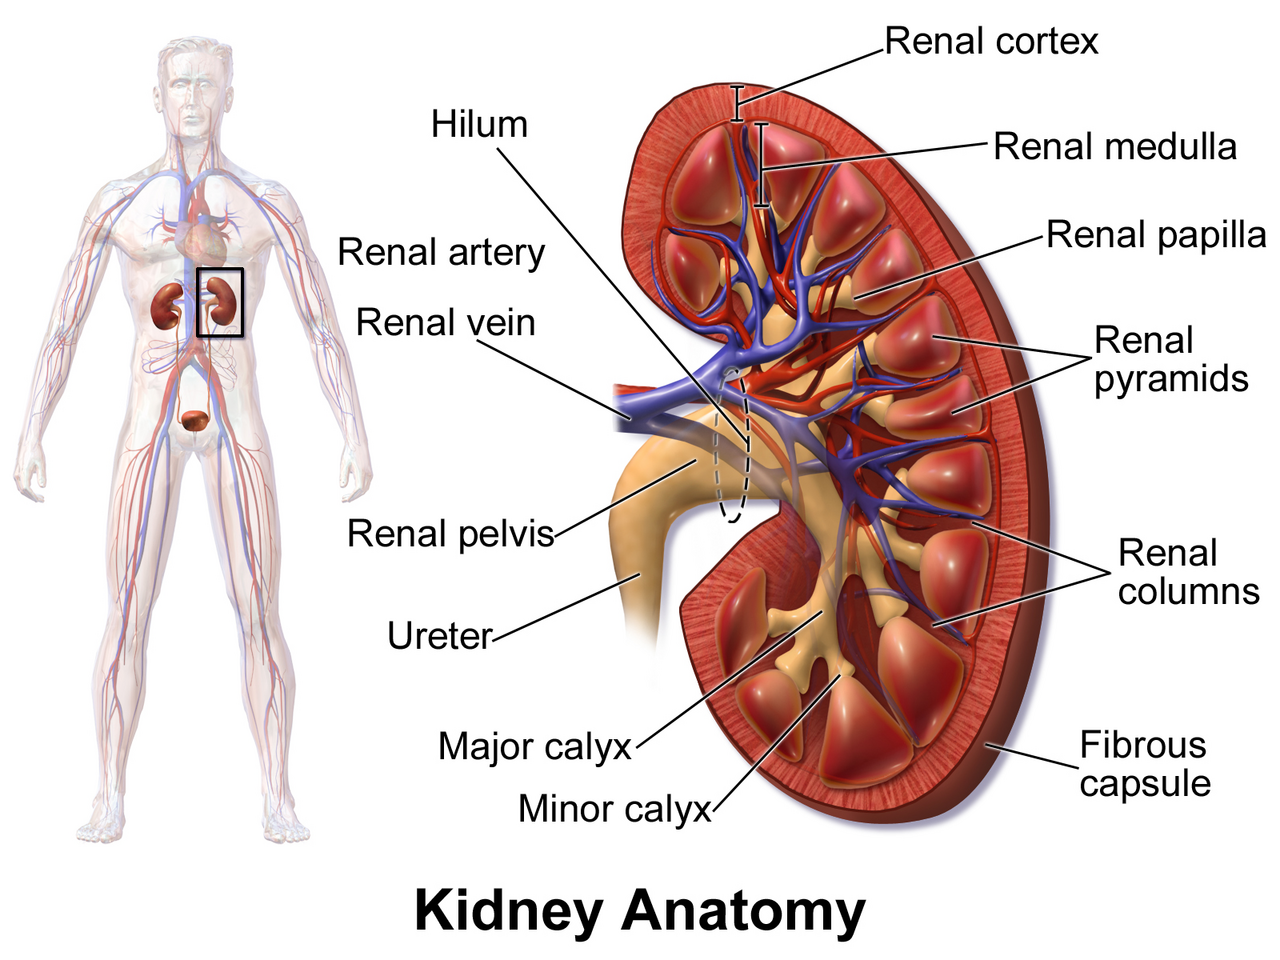
Kidney nephron structure
Kidney Function & Electrolytes
Jul 20, 2026 8 min read

Cystatin C Blood Test: When It Adds Useful Information Beyond Creatinine

Learn what cystatin C measures, why it's less affected by muscle mass than creatinine, and when guidelines recommend using it to confirm a borderline eGFR result.

By Elements84 Editorial Team
Read
Clinical Interpretation

Within reference (3rd–97th percentile)Normal

A height within the 3rd-97th percentile band sits in the CDC reference range for age and sex — where the vast majority of children fall.

Common causes
  • Typical growth pattern
Lifestyle considerations
  • Continue balanced nutrition + regular sleep
  • Encourage physical activity
  • Growth is a trajectory — one datapoint is one signal
When to consult a healthcare professional

Routine paediatric check-ups.

Medical Evidence

How we ground the Height Percentile

Grade A · Clinical guidelines & meta-analysesLast reviewed Feb 12, 2026
Named clinical guidelines
  • Kuczmarski RJ et al. (2002) — CDC 2000 Growth Charts — Advance Data No. 314
  • Cole TJ, Green PJ (1992) — Smoothing reference centile curves: the LMS method
References

The Evidence Foundation

Health information should show both what is known and where certainty ends.

Elements84 brings reviewed health evidence, practical decision tools and plain-English explanations together without presenting educational guidance as diagnosis or treatment.

  1. Named sources
  2. Human evidence separated from theory
  3. Limitations shown beside conclusions
  4. Educational, not diagnostic

Reviewed health evidence, practical decision tools and plain-English health education.

Educational information only. Elements84 provides educational information and decision-support tools. It is not a substitute for professional medical advice, diagnosis or treatment.

© 2026 Elements84.